I Tried to Build the World's Fastest SPA (And Failed Miserably)
My scoreboard app felt instant. Lighthouse disagreed. This is the story of chasing a number, nearly wrecking my architecture over it, and learning what actually mattered instead

- Jacob
- 13 min read

Introduction
My initial goal for this post was to prove that the web has become unnecessarily slow. We have miraculous hardware - data travels at two thirds of the speed of light and processors execute billions of instructions a second. Given that a webpage is ultimately just styled text and boxes, it should be lightning fast, right? But instead, the threshold for a “good” Largest Contentful Paint (LCP) is 2.5s. I considered this to be silly - surely we can do better given the hardware we have?
To prove it, I built and optimised a scoreboard Single Page Application (SPA). Testing against production on my own laptop, I’d done it: an LCP of 0.4s. Everything felt blazingly fast - navigation was instant, and actions felt very responsive.
Then I ran the tests on a simulated slow 4G connection with a slow CPU. More than 3 seconds. Even after optimising almost everything I could think of, I still couldn’t get below 2s - barely below the 2.5s I thought was laughably slow. How could a snappy, lightweight SPA feel instantaneous to use, yet fail the very metric designed to measure speed?
I kept asking myself: “is my app fast?”
I should have been asking: “fast at what?”
My app is fast!
Even before I made any intentional optimisations, my app was fast! Navigation was quick, interactions were responsive, and there wasn’t any obvious waiting around. This is what piqued my interest - how far could I push this? So I started by looking at LCP - how long it takes for the largest visible piece of content to fully render on a user’s screen. I opened up the “performance” tab on Google Chrome, hit refresh and boom: 0.4-0.5s LCP. The numbers backed it up - my app was already absurdly fast. I was pretty happy with myself, but could I go further?
The speed was a lie
So, I got to work digging deeper into the metrics. I ran a full un-throttled Lighthouse test and was a bit disappointed - it showed a 928ms LCP. Don’t get me wrong, that’s still a good LCP, but I knew I could cut that number down. Why was this number bigger? The way the “performance” tab in Chrome and Lighthouse measure LCP is slightly different. The two tests weren’t directly comparable - Lighthouse starts each run from a clean state, whereas my browser’s “performance” panel could benefit from resources already in its cache. But details aside, almost 1 second to load the page still seemed slow to me.
Note:
Lighthouse is an automated tool, built into Google Chrome, used to measure performance, accessibility, and SEO.
All my Lighthouse statistics were collected by running the Lighthouse CLI 5 times against the scoreboard page of my app and averaging the results.
But, what would be a good aim for LCP? Core Web Vitals says that a 2.5s LCP at the 75th percentile (P75) is considered “good”. Now I have a pretty fast laptop and a decent internet connection. My problem was, I didn’t have many users of my app (just me and the friends I live with), so a P75 would be inconsistent and unrepresentative. But there was a solution - use the “throttled” mode in Lighthouse. And it solved two problems:
- I figured throttled Lighthouse would give me something roughly representative of a P75 of a larger user-base
- It worked as a consistent environment to test my performance changes against. It stabilised the network latency and CPU processing speed, making it much easier to tell if a change was actually improving LCP
Right, let’s run Lighthouse in this “throttled” mode against my app. Wait, a 3.27 second LCP?! Now that’s slow. That’s not even hitting the “good” threshold. I was really disheartened by this - how could an app that felt so fast have a terrible score? I had to do something.
I attacked the obvious sources of waste: bundle size, caching, lazy loading, dependency reduction, unnecessary backend work, and preloading. I also added Cloudflare as a reverse proxy to leverage its global caching and DDoS protection. While this did slightly increase LCP for me (as the extra hop adds overhead), it was still a net win globally. Despite that overhead, the rest of these changes brought LCP down to 2.37s - a much better result, and just under the “good” threshold. But it was “just” under. I’d hoped to smash it.
So I went further. But at this point, my backend was already fast enough. My frontend was already fast enough. My database was already fast enough. Requests to my Rust backend were processed in ~20ms on average, Total Blocking Time (TBT - the total time a web page is unable to respond to user input during the loading process) on my SolidJS frontend was ~50ms on average, and database queries completed in single-digit milliseconds. Those weren’t the problem - computation wasn’t my bottleneck. The expensive thing often was waiting - how could I reduce waiting?
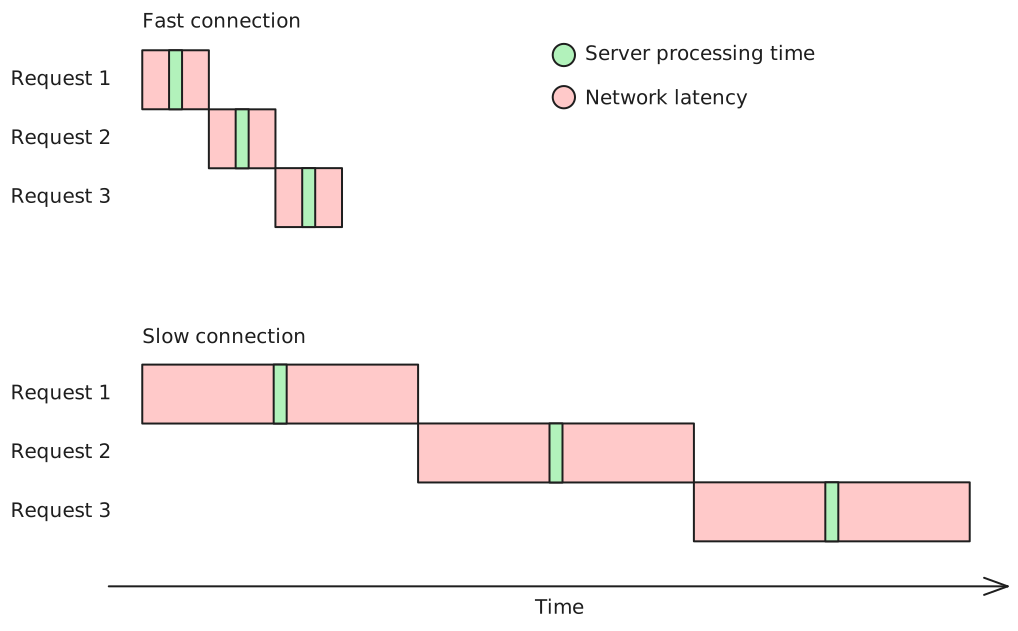
The problem I was having was evident when I looked at my network waterfall. There were sequential API requests. I had three distinct sections - fetching the initial index.html and JavaScript (JS) bundle, requesting authentication/user data, and requesting the page data. Each was waiting on the last to complete. This problem compounds as network latency increases:
However, if these requests could be made in parallel, the waterfall would look a lot better - far less impact from a high latency:
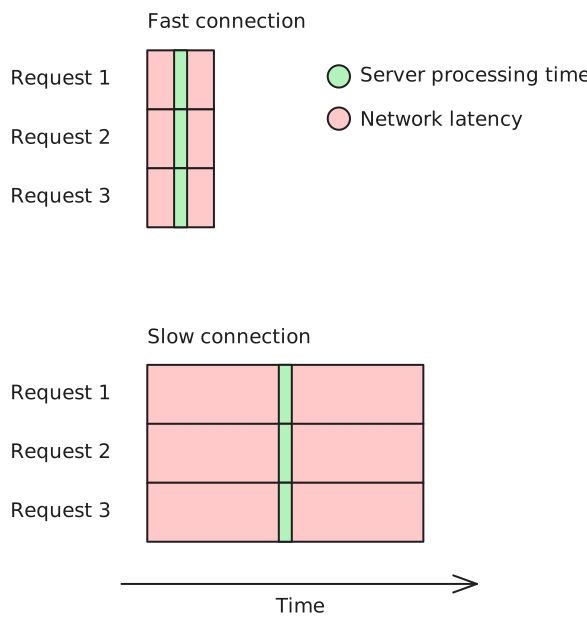
And in my case, authentication and page data could be done in parallel. The problem was not that page data required the auth data request to have finished. Each API request validates the authentication/authorisation itself, so no need to wait. Instead, the problem was that I had blocked the UI from rendering until auth data was present. That meant sub-components that handled fetching their own data weren’t mounted until the auth request came back. The fix was simple - allow sub-components to render, and just use skeleton/loading states, cutting out a whole round trip.
On top of that, I cut down latency by removing more unnecessary packages, and splitting up components to reduce the initial bundle size. This got the LCP down to 2.06s - a nicer margin under 2.5s, but still not the blazingly fast speed I’d hoped for.
I had pushed client-side optimisation as far as I could without making fundamental architecture changes, which brought me to an important realisation:
Choosing an efficient runtime and keeping the frontend lean absolutely helped. But there’s an important distinction between choosing technology that isn’t a bottleneck and actually doing performance engineering. Rust being fast didn’t eliminate network latency. SolidJS being efficient didn’t eliminate round trips. Once those components were fast enough, making them faster wasn’t where the meaningful gains were.
Making it blazingly fast
I was starting to reach diminishing returns with my performance improvements. But I still needed something big to make it blazingly fast. The problem was still the round trip time. The previous fix had cut out the unnecessary dependency where page data waited on auth data. But now there was a new bottleneck - no matter how well-optimised I make my components, the browser physically cannot request page data until it’s downloaded and executed the JS that would make that request. This couldn’t be solved with my existing architecture.
The obvious solution here is Server Side Rendering (SSR): render the initial page on the server, so the HTML sent to the browser already contains the data it needs. In my setup, I use a single Virtual Private Server (VPS) to host everything. This would make API calls incredibly cheap from the SSR framework - they’d be going to the same machine, which means almost no latency. By the time the page is received by the client, it’s already got all the data needed. No need for multiple round-trips. SolidJS has an SSR framework already - SolidStart, so the support was there. But I didn’t want to completely change up my architecture. From previous experience with SSR, I’ve not been a massive fan of the developer experience (DX) - it blurs the lines between client side and server side, when sometimes the distinction is useful.
Instead of full SSR, what if I just used the Rust backend to inject the auth state and page data directly into the <head> of the index.html as a global JavaScript object? The front end could read the data directly from the window object, instantly cutting out two round-trips without forcing me to rewrite my entire frontend architecture. And this is a well-established pattern - send the initial application state alongside the HTML so the client doesn’t have to fetch it again.
Note:
I’ve heard this concept called by a few names before, including preloaded state and state injection.
This would work! Looking at the waterfall, we could save ~300ms on a throttled device. That would take the LCP down to ~1.7s - a much better score.
Note:
Estimated from the Lighthouse waterfall by measuring the time between the initial HTML download and completion of the final page-data request. This wasn’t a measured LCP, so the 1.7s figure is an estimate.
But wait… What exactly had I spent all this time optimising? It had all been to reduce the LCP - the initial page load speed. That only happens once though. Users of my app spend most of their time clicking around within the app - looking at individual player scores, recording games, etc. LCP says almost nothing about those interactions. What were users actually gaining for that improvement? Load performance and interaction performance are not the same.
That’s when I thought: “Is it worth it?”
I’ve really been enjoying the Keep It Simple, Stupid (KISS) principle recently. Avoiding a complex setup makes maintenance so much easier, and mental overhead lower. My aim was to push this to be an incredibly fast web app, but was I making the right trade-offs for what I wanted to be fast?
To implement preloaded state, I would have to break the separation of concerns between my API and UI, duplicate routing logic in Rust, and add state-cleanup hacks on the frontend. I was about to trade clean architecture and maintainability for a fraction of a second on a page load metric that my users only experience once per session.
The optimisation wasn’t wrong. My objective was wrong. I’d shifted from a goal of a fast app to a goal of a low LCP, falling into the trap of Goodhart’s law. Marilyn Strathern’s 1997 formulation puts it nicely:
When a measure becomes a target, it ceases to be a good measure.
Optimisations are rarely free. You can compromise on DX, maintainability, correctness, complexity, infrastructure cost, or reliability etc. for a performance improvement. Whether that’s worth it is specific to what matters and how much it matters.
The wrong north star
LCP isn’t the whole experience
I kept asking “is my app fast?” when I should have been asking “fast at what?”
LCP wasn’t giving me the whole picture. It only measures one aspect of the user’s experience: how quickly the largest piece of content appears during a page load. For my web app, that was a much less important part of the experience than it would be for a content-focused site.
Understanding performance means learning what your users are trying to accomplish, and optimising those paths. Once you know how users interact with your app, you can gather a range of relevant metrics - not just generic performance metrics, but ones that matter to your users.
For my app, I care about users recording games, viewing player stat breakdowns, etc. So instead of starting with “which performance metrics should I optimise?”, I should have started with “what are my users trying to accomplish?”
| What do I want to know? | Possible measurement |
|---|---|
| How quickly does the initial page appear? | LCP |
| How quickly does the UI respond to input? | INP |
| How long does recording a game take? | Custom task duration |
| How long until the UI reflects the saved result? | Time to settled |
| How are real users experiencing all of this? | Real User Monitoring (RUM) |
Note:
Time to settled isn’t a standard browser metric, but it describes something I actually care about: how long it takes for an action to finish and the UI to settle into its final state. The difficult part is defining what “settled” actually means. The browser can’t determine that automatically because it differs from app to app. I’d need to define and instrument this metric myself - the point at which the request responsible for the user’s action completes and the UI reflects its result.
I’d missed some decently obvious UX improvements because of my obsession with LCP. Notably, I hadn’t implemented optimistic updates when performing actions like adding or removing users from a group. That would make the actions feel instantaneous, but it wouldn’t move the needle on LCP.
Lab rats vs. real users
Whose experience was I measuring? Lighthouse was giving me a consistent environment to compare one version of my app to another. I was treating Lighthouse’s throttled configuration as though it were a proxy for my users’ P75. It isn’t. P75 isn’t a particular device, CPU speed, or network configuration. It’s a statistic describing the distribution of experiences across your actual users. Without enough real users, I simply couldn’t know what that distribution looked like. The tests weren’t useless - they were controlled, synthetic conditions. I just shouldn’t have pretended they represented what real people are actually experiencing. Using Real User Monitoring (RUM) would give me reality. It would show me what my actual users are experiencing. In combination, RUM and Lighthouse tests would give me a much stronger understanding of my app’s performance.
Was I too harsh on the web?
Yes. And no. Sometimes as developers we make bad choices for performance. And sometimes the problem is genuinely hard.
The web certainly has unnecessary bloat. Packages that aren’t needed, complicated frontend frameworks for simple content-focused websites, large assets, etc. As developers, we often reach for abstractions and frameworks without considering performance cost. I’d done this with a few packages I didn’t really need, including Axios. Being more careful around these choices would definitely help improve the web as a whole. Performance can be deprioritised, especially in a company where features provide a more tangible goal for non-developers.
But, there are trade-offs. And performance isn’t always simple, it’s not about pure computation power. A fast CPU doesn’t make a fast network. A fast backend doesn’t eliminate round trips. A small database query doesn’t help if you have to wait 200ms for the request to get there and back. As I realised earlier, all the individual parts of my system were fast. The expensive part was often waiting. And web apps are complicated, there are APIs, databases, network latency, third-party services, real-world hardware, complex state, browser constraints. Trying to keep all of that lean and fast isn’t an easy feat.
Conclusion
So I hadn’t achieved the LCP I’d aimed for. I’d failed miserably at making my app the fastest in the world. But that’s because I hadn’t defined “fast” well. I picked one metric and ran with it without considering what it actually meant for users. Once I clocked that, I had realised that a 1.7s LCP wasn’t worth the engineering trade-off.
By understanding how users actually use my app and what matters for their experience, I now realise there are other areas I could improve to make a big difference to UX. RUM gives insight into this too - I plan on expanding the real-world metrics I’m gathering, including measuring time to settled on some key actions. I mentioned earlier optimistic updates would improve UX even though they don’t affect LCP. That’s something I plan on implementing next, and I’ll cover all the technical details on that in my next post.
I started trying to make a number smaller. I ended trying to make an experience better.